
Committed Spend Report
Overview
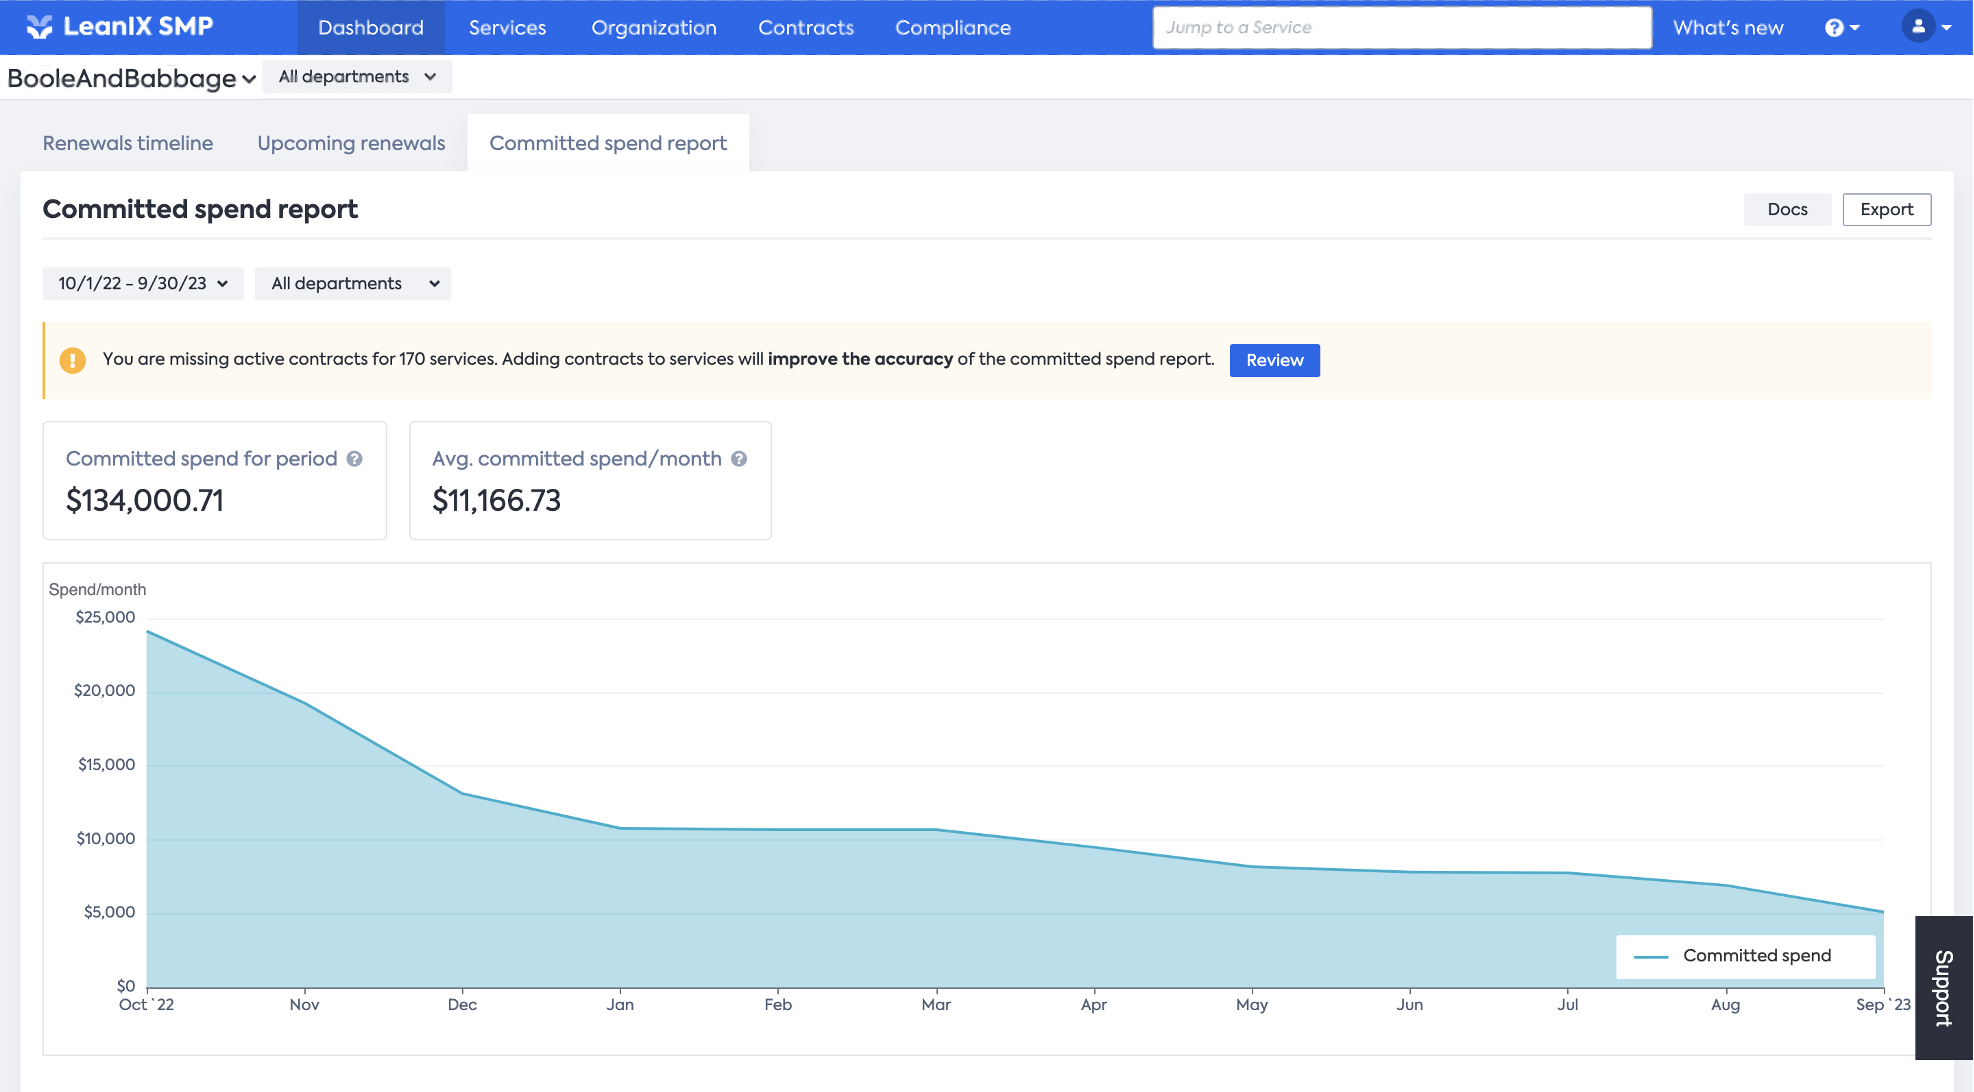
With the Committed spend report, SMP gives you a timeline showing an aggregated view of all your Committed spend. The tool takes all your existing contract types and values into consideration to build a picture of your future costs per Service and per Department.
Report setup
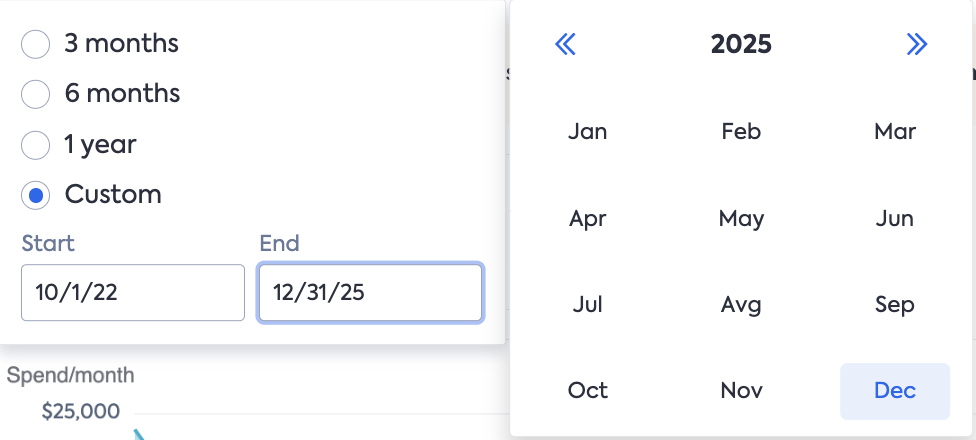
In order to create a report, you will have to configure the 2 following parameters (on the top left side of the page)
- Time frame: allows you to define which period the report should cover.
- Department selection: select or deselect the Departments that you would like to include/exclude from the report.
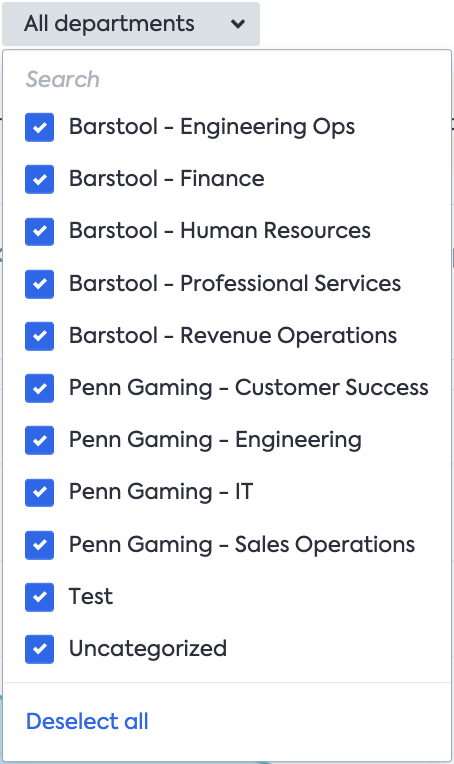
Note: the graph will be automatically updated as soon as you modify the Department selection.
Results
After defining those 2 parameters, you will probably see the following banner:

This banner tells you that SMP found -for the desired time frame- services without a contract. Since this report is based on the contract value, the current result generated does not reflect your entire upcoming costs. To learn more about the Services concerned, click on "Review" and verify the list provided below:
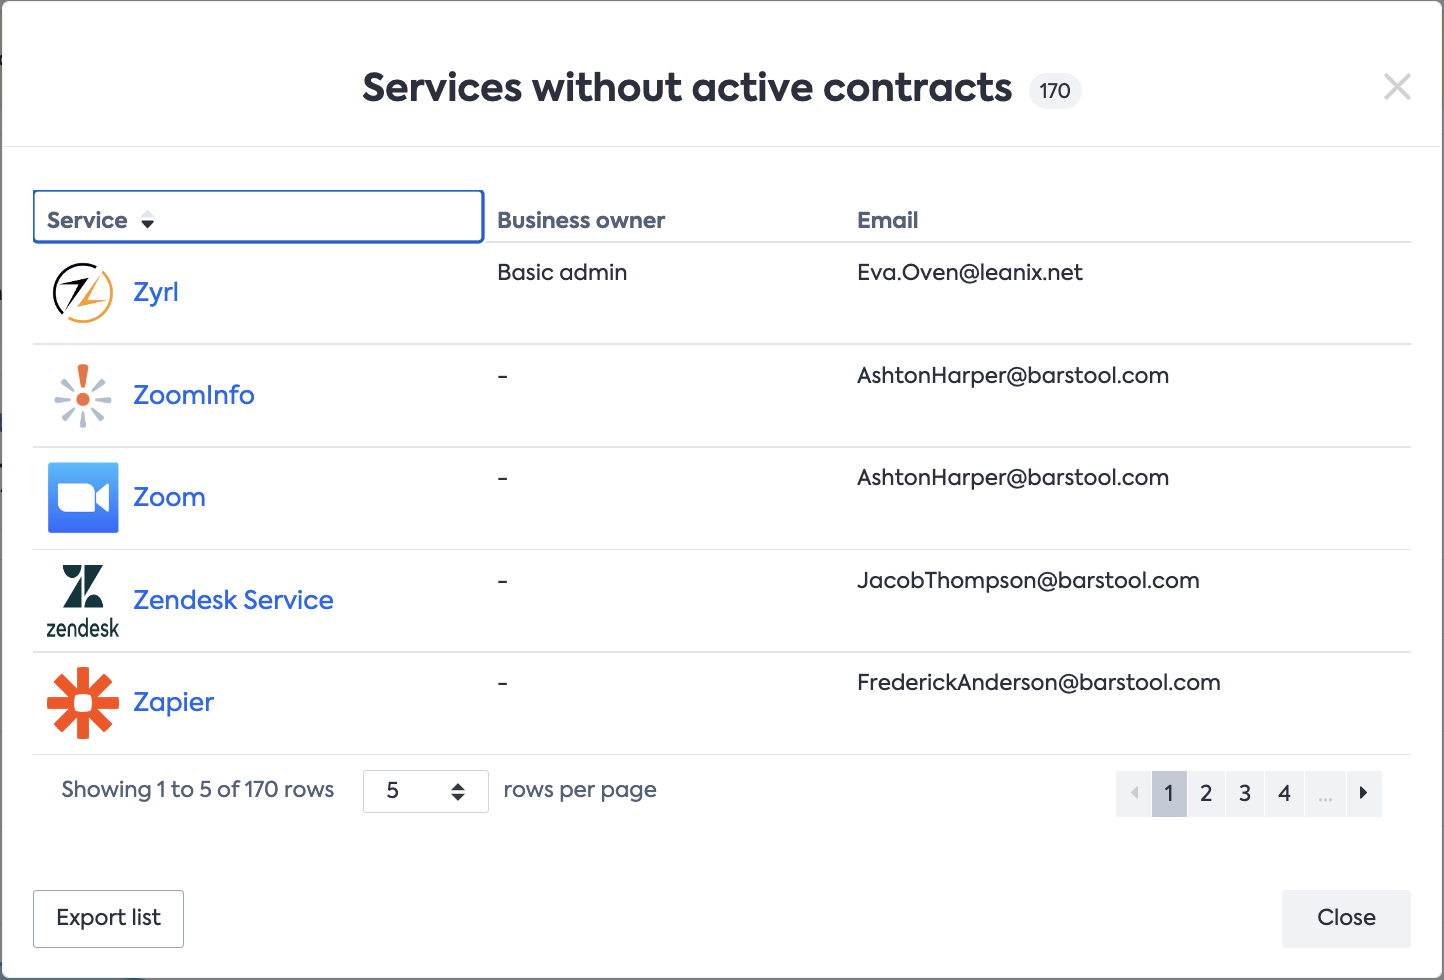
After verifying this list let’s take a look at the main results.
On the top left of the graph, you will see the 2 following cards below:
- Committed spend for period: the total amount of the Committed spend for the selected period.
- Average Committed spend per month: equals the _Amount of the contract value_divided by the number of months in the contract period.
After this SMP provides you with a graphical interpretation over time.
Y axis: monthly Committed spend per month
SMP divides (for all existing contracts) the total contract value by the length (number of months). So if a service X has a 12-month contract with a total value of 24 000$, my monthly Committed spend will be equal to 2 000$ per month.
X axis: time (in months)
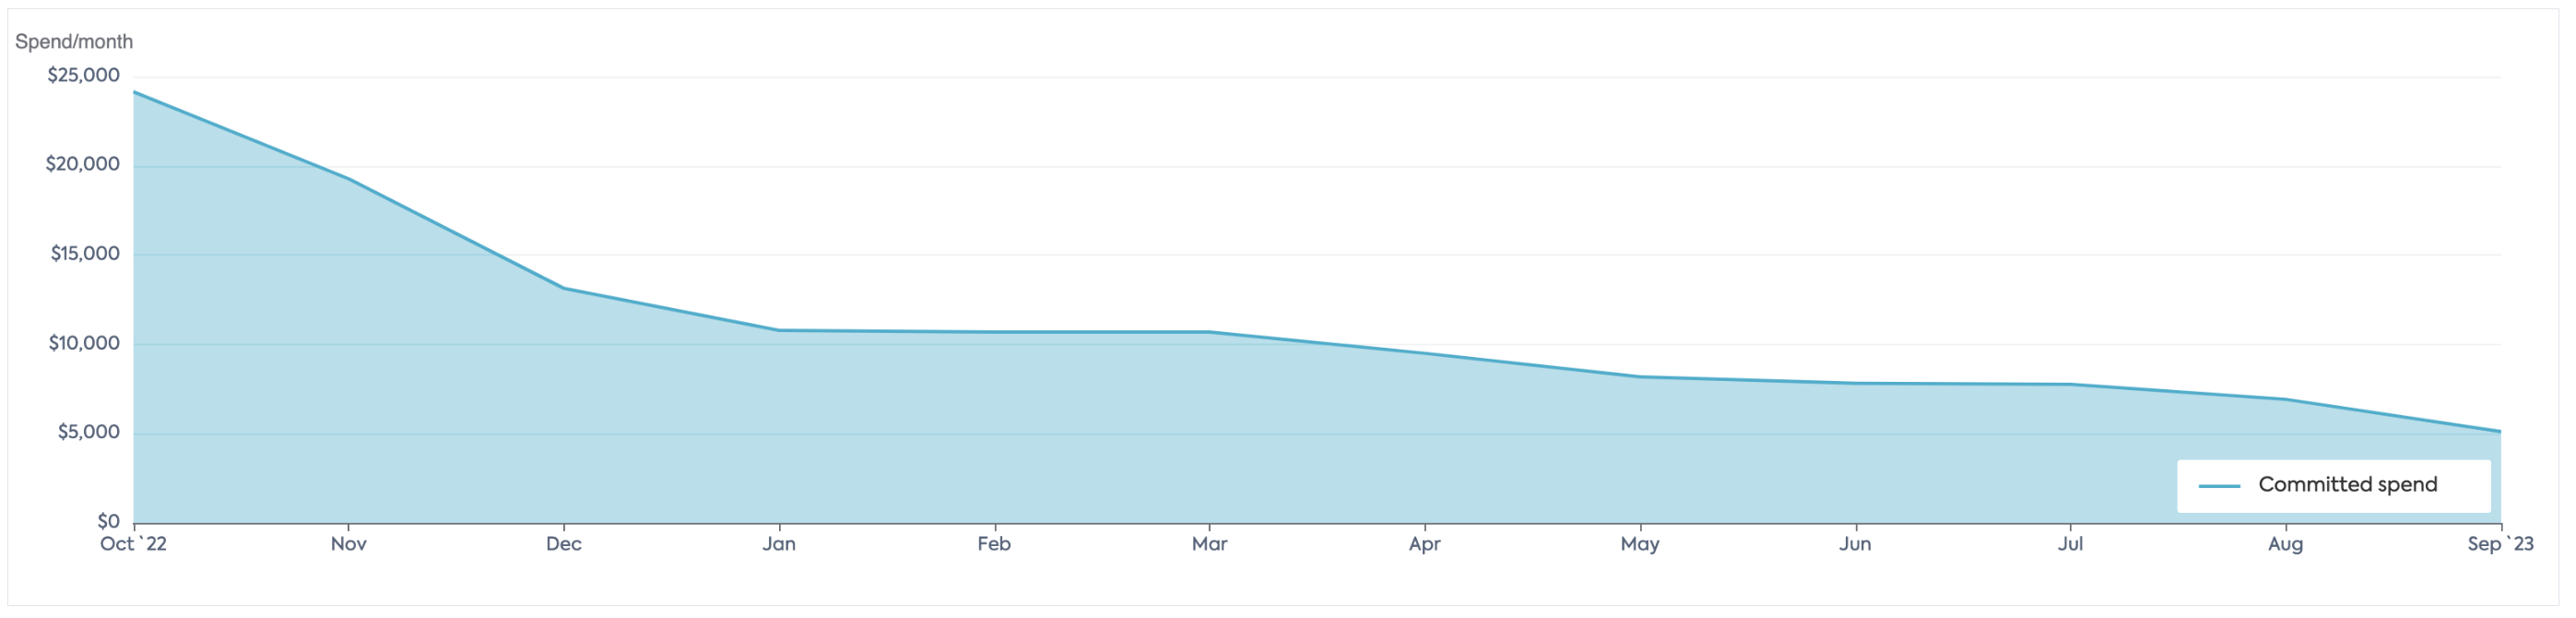
Note: The curve will naturally go down since by default, contracts are going to expire.
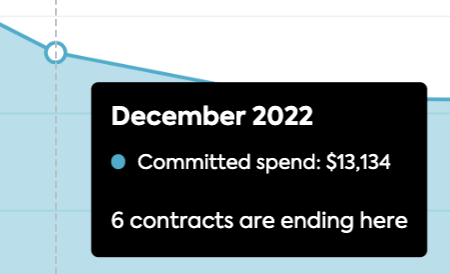
Whenever you want to verify which contract is ending, simply over to the specific month to review the number of ending contracts:
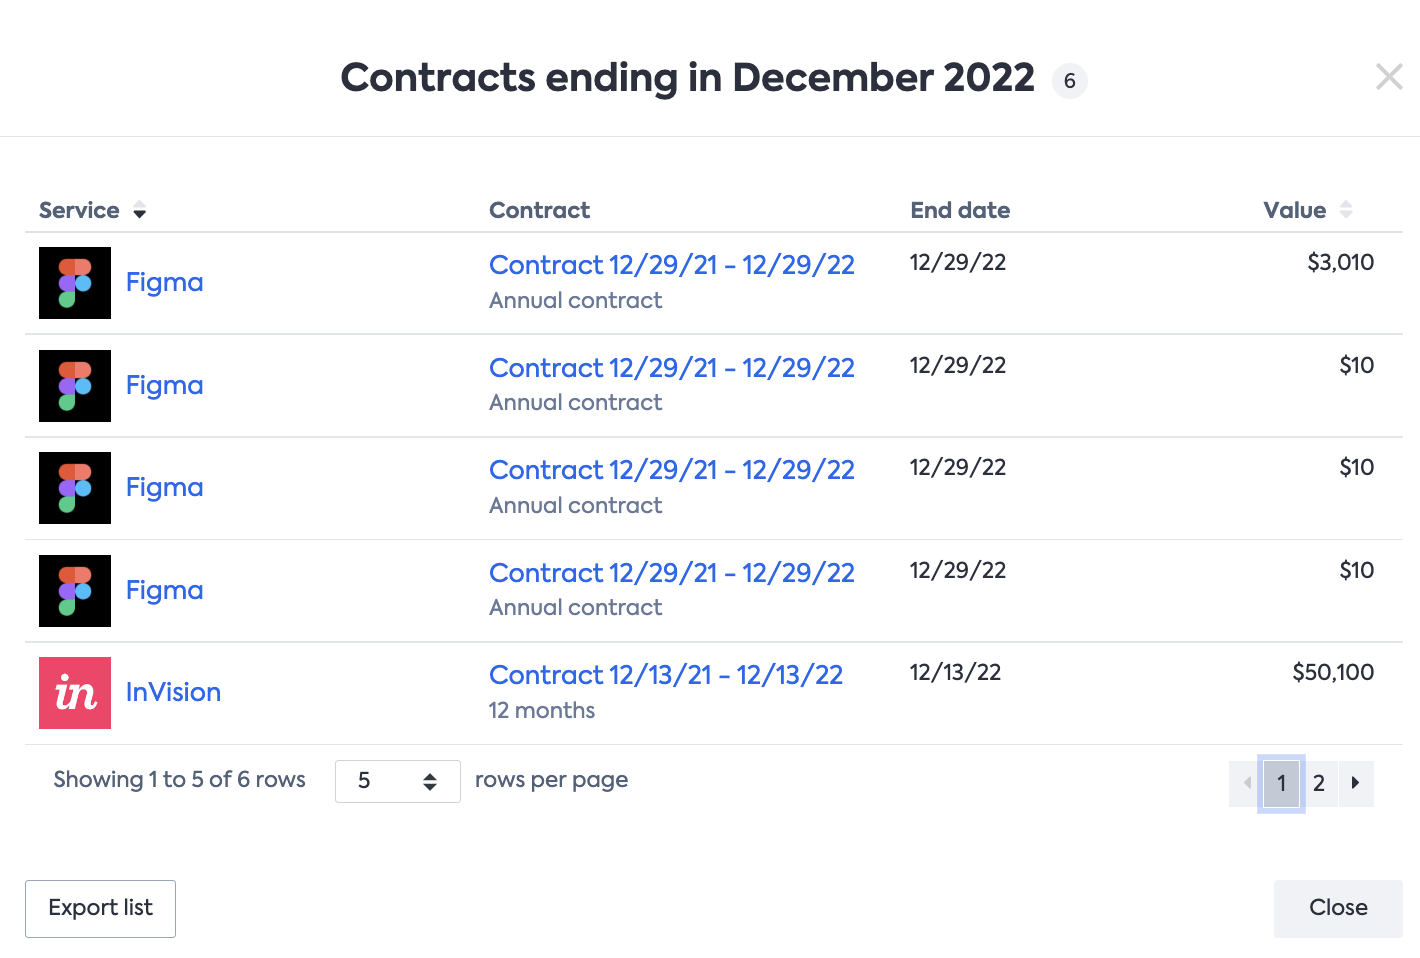
or click on the dot to get the list of the contracts name ending in the selected month:
Recommendation: Since SMP (as of now) cannot simulate how your next contract will be, you can optionally (for the most important service) create a "draft contract" reflecting the criteria (value + length) that you will sign after your renewal.
With this, you will get closer to your real Committed spend regardless of the period selected.
Service overview
After taking a look at the high-level figures of the report, you will find a table presenting all the contract details per service as below:
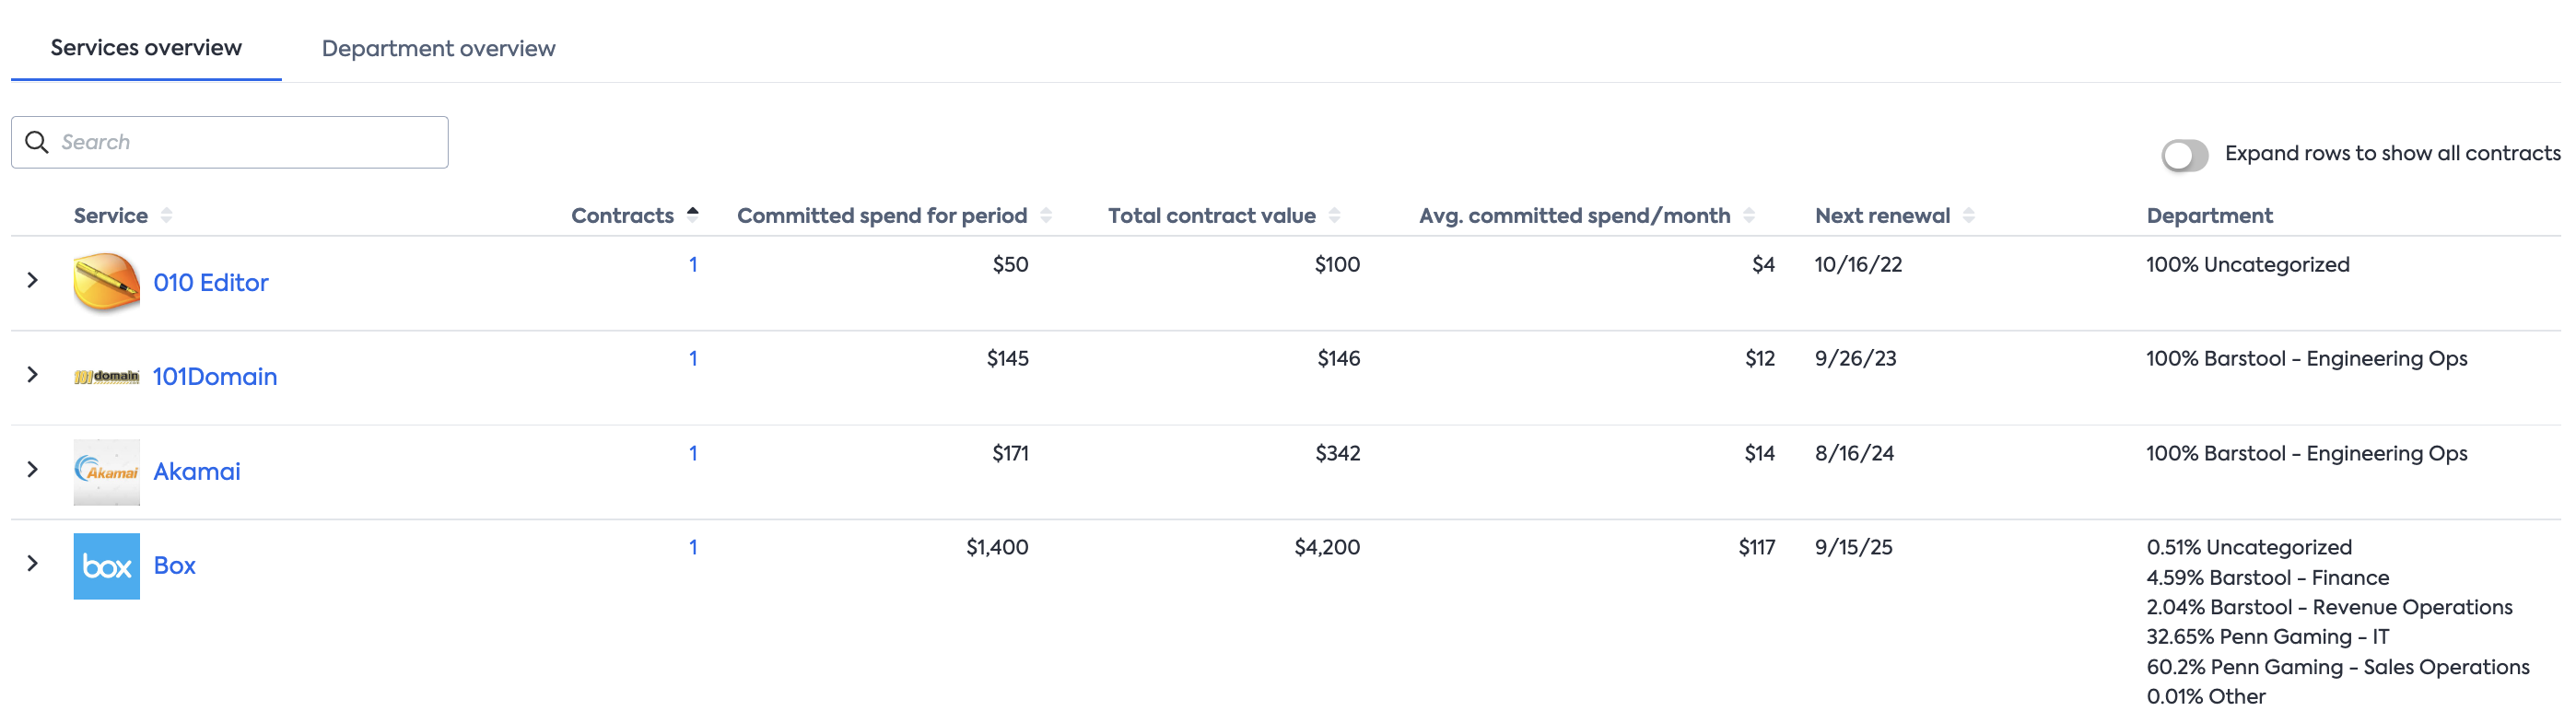
here you will get the following details per service:
- Number of contracts
- Committed spend for the selected period
- Total contract value
- Average Committed spend per month
- Next renewal date
- Department ownership
Note: the table will be automatically updated as soon as the report parameter will be changed (Tome frame & Department selection)
Department overview
the second tab available on this report shows how the Committed spend is split across your departments:
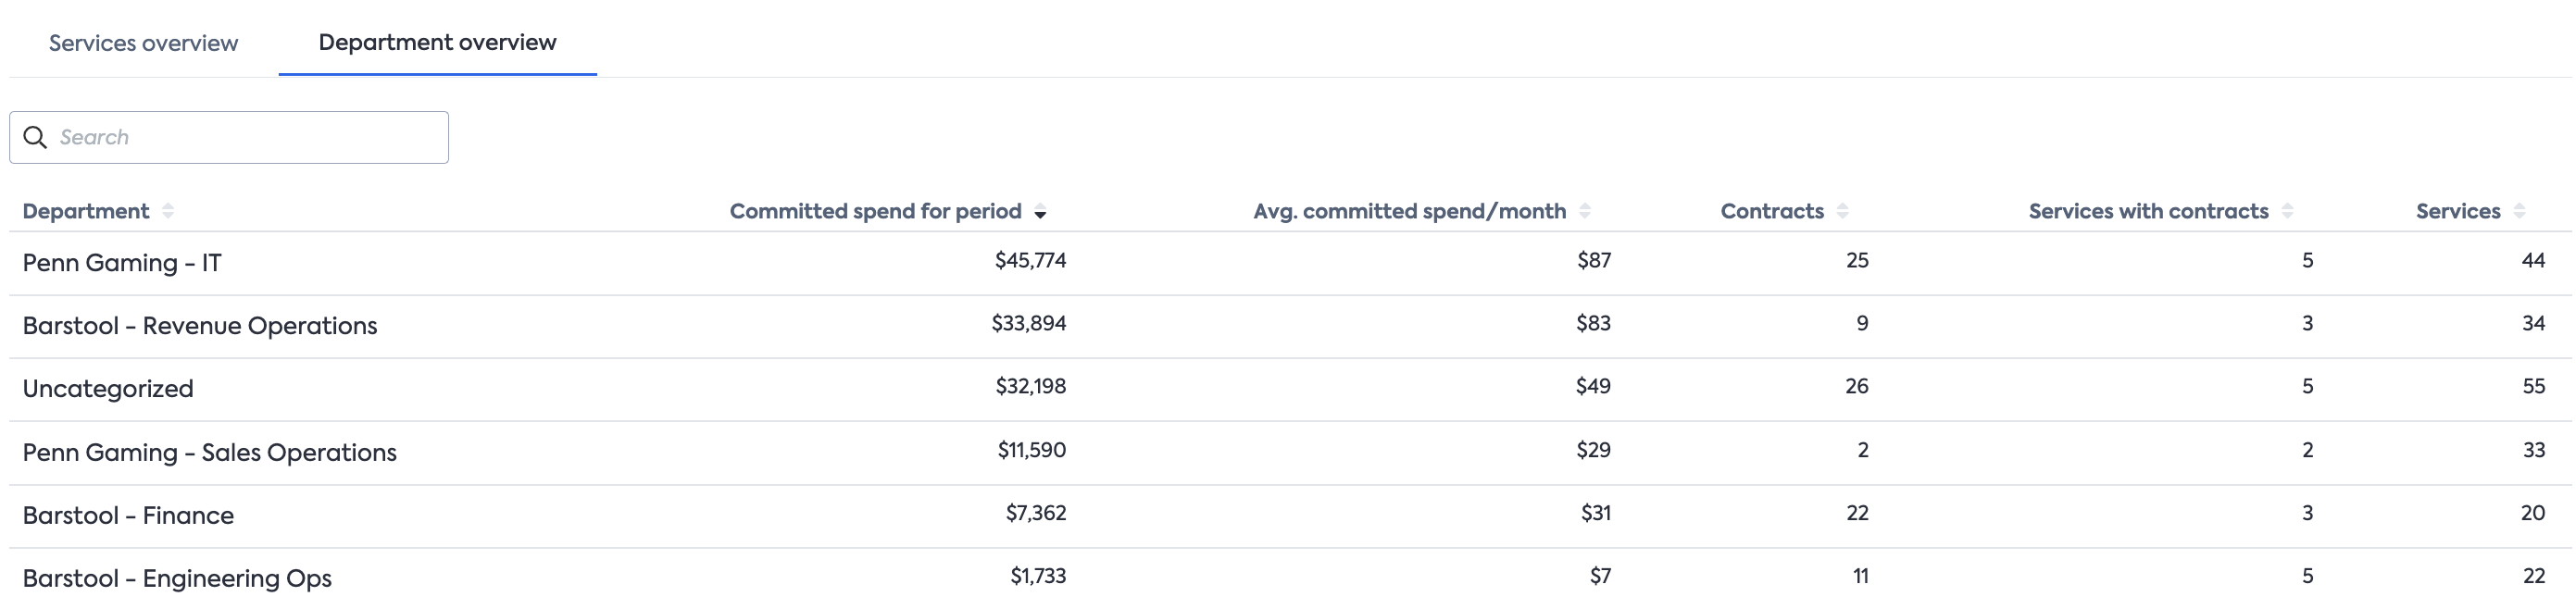
here you will get the following details per department:
- Committed spend for the selected period
- Average Committed spend per month
- Number of contracts
- Number of Services with contracts
- Number of Services
Updated about 1 year ago