
Observability
SMP offers an overview on your Manage Integration status. With this, you automatically get warned whenever your Manage Integrations are not working as expected.
Manage Integration errors visibility
When navigating in SMP you will see these error messages in different manner:
- via the Service List:
A red exclamation mark will be displayed close to the Service name, and a tooltip will display the error message.
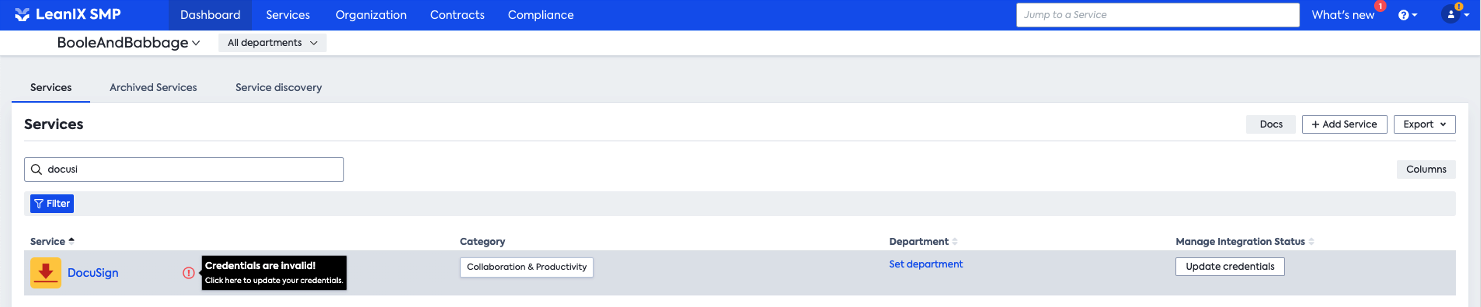
Click on the icon to review these errors under the Manage Integration menu. - via the Service overview:
A red banner will be displayed on the top of the Service overview with the action button "Diagnose errors".
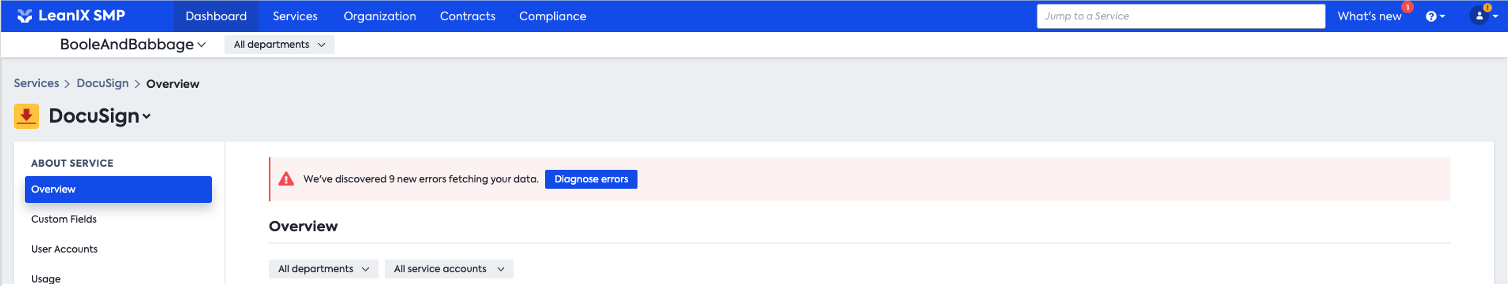
Click on the button to review these errors under the Manage Integration menu.
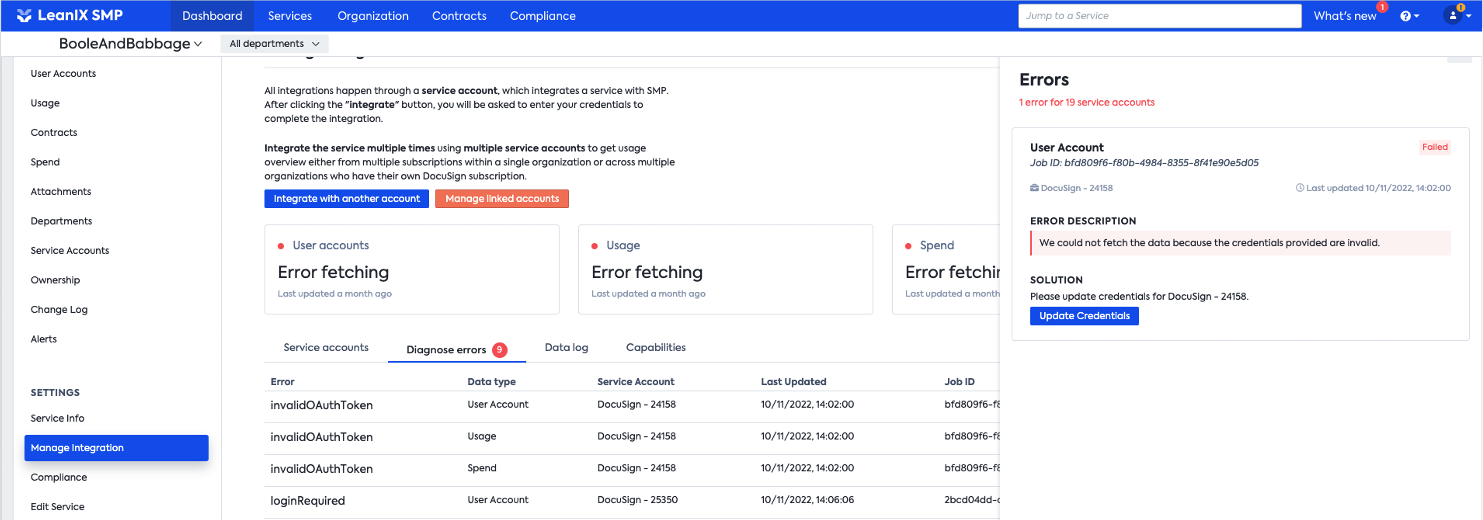
Reviewing Integration errors
After clicking in the error message (as described above), you will be redirect to the Manage Integration menu. Here you will found the status card per Integration capabilities:
- User accounts
- Usage
- Spend
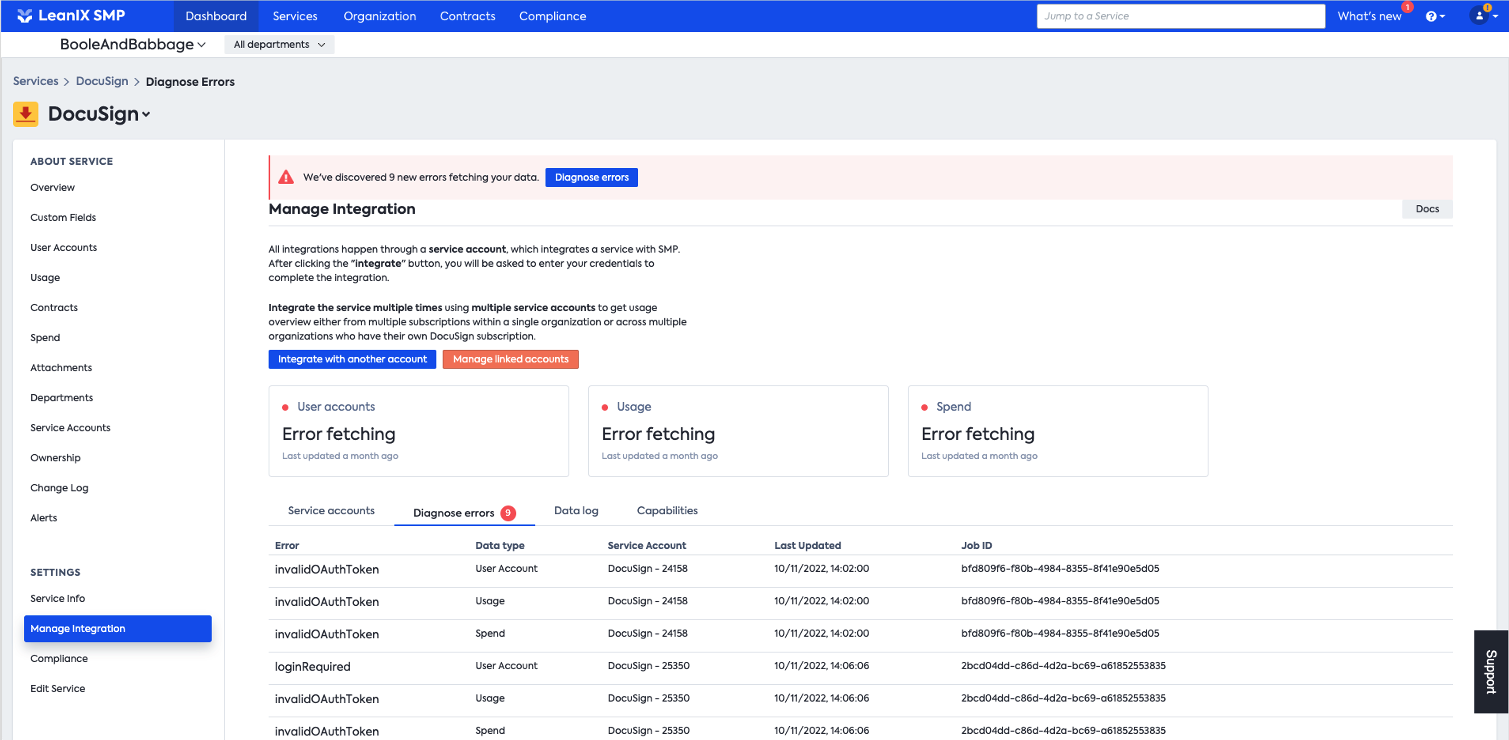
At the bottom of the page you will find the identified errors under the tab "Diagnose errors" plus the number of errors found
By hovering the mouse over an error log you will see the button "Diagnose" appearing:
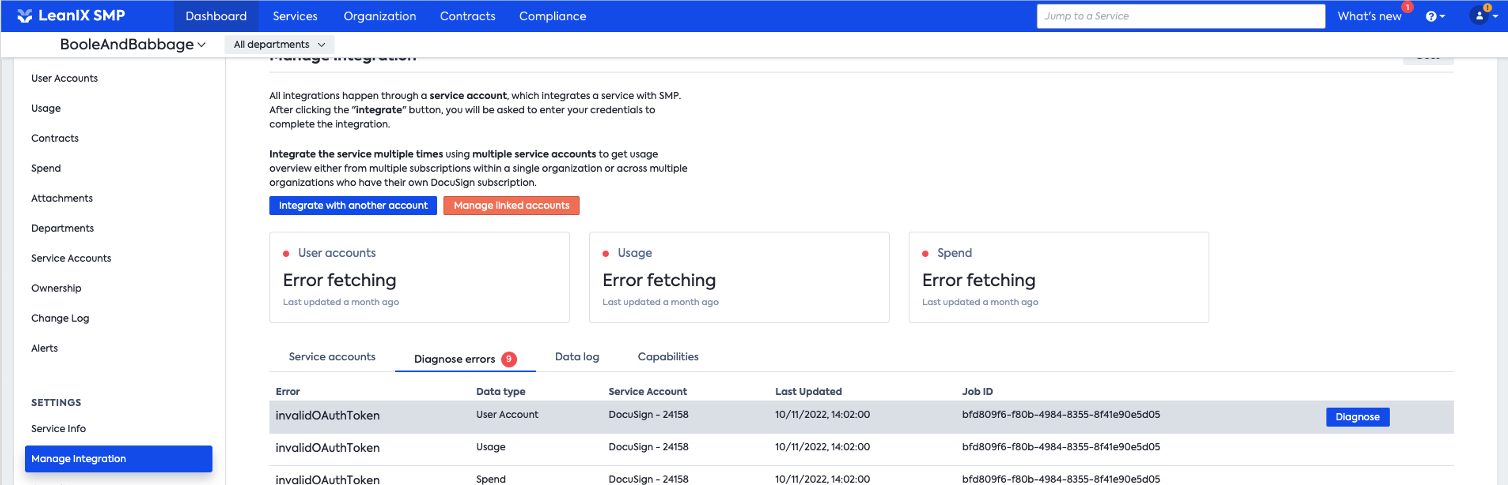
Then the side panel will open on the right side displaying the error message and the action that needs to be taken:
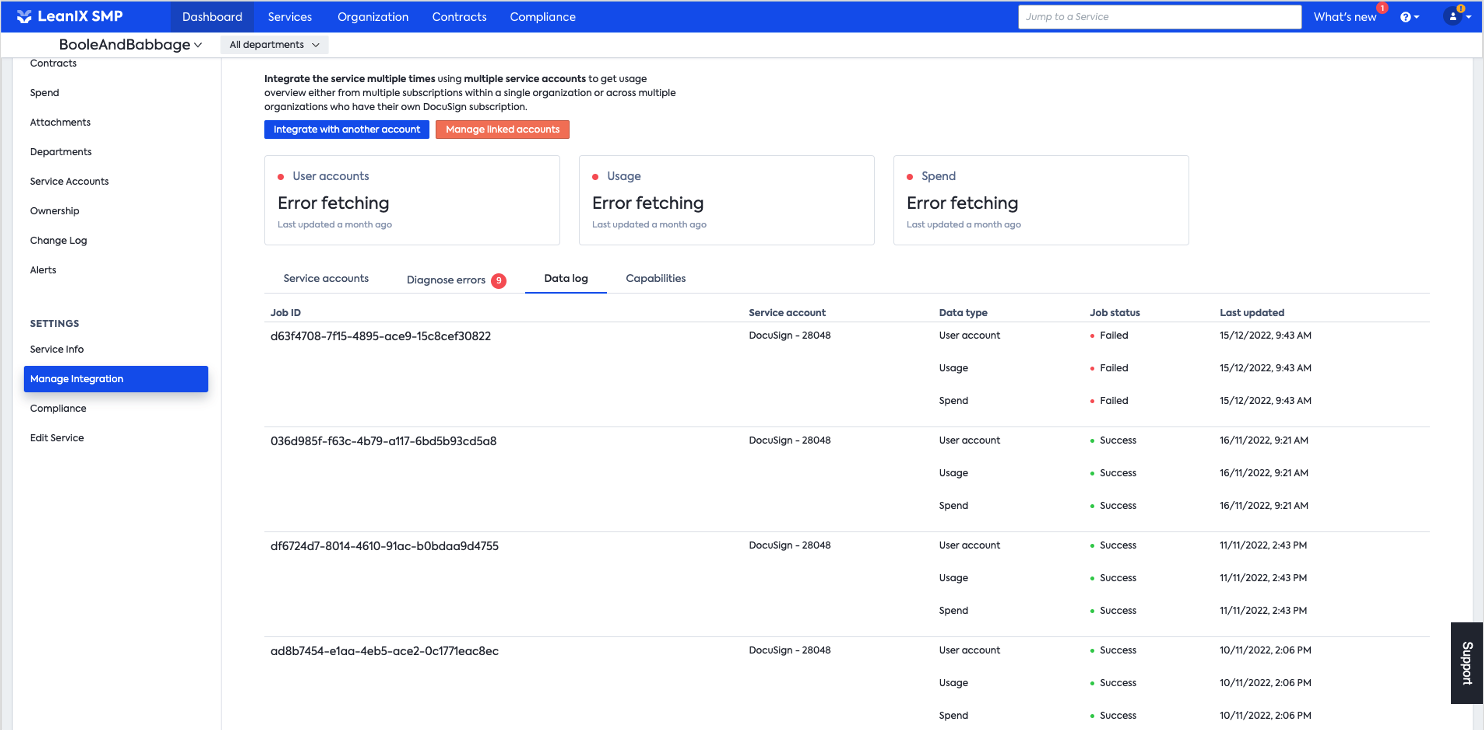
Reviewing Data logs
Data log allows you to drill down to data fetching process historic. This view provides you with:
- Job ID
- Service account
- Data type
- Job status
- Last updated
Updated over 1 year ago